python 3D绘制立体几何
发布时间:2019-08-07 14:07:05编辑:auto阅读(3281)
直接复制就能用,写的简单,请勿吐槽
import numpy as np
import mpl_toolkits.mplot3d
import matplotlib.pyplot as plt

x=[0,3,0,3,1.5]
y=[0,0,3,3,1.5]
z=[0,0.8,1.5,2.3,3]

ax=plt.subplot(111,projection='3d')
for i in range(len(x)):
    for j in range(len(y)):
        ax.plot((x[i],x[j]),(y[i],y[j]),(z[i],z[j]),color='red');

for i in range(len(x)):
    ax.text(x[i],y[i],z[i],i,color='blue')


ax.set_zlabel('z')
ax.set_ylabel('y')
ax.set_xlabel('x')
plt.show()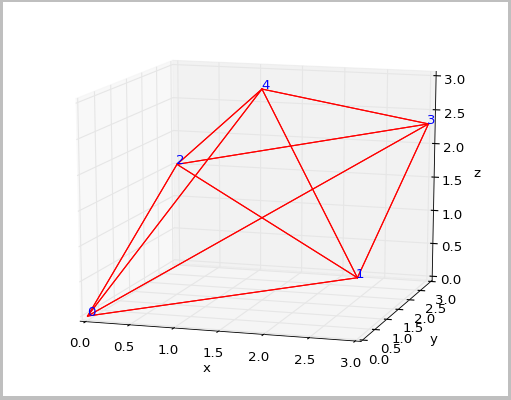
上一篇: Python进行远程视频监控
下一篇: python生成安装文件 msi
- H3C基本命令大全
53102
- H3C IRF原理及 配置
40024
- Python exit()函数
34408
- python全系列官方中文文档
30158
- python 获取网卡实时流量
25058
- 1.常用turtle功能函数
24856
- python 获取Linux和Windows硬件信息
23231
- 天天基金网数据接口
16710
- Selenium使用代理IP&无头模式访问网站
14865
- Selenium&Pytesseract模拟登录+验证码识别
14358
- LangGraph Studio可视化
703°
- LangSmith开发-应用入门
648°
- LangGraph开发-多轮对话问答机器人
715°
- LangGraph开发-条件分支/循环图实战
732°
- LangGraph开发-生态介绍,入门demo实战
779°
- LangChain-接入12306-HTTP MCP智能体
909°
- LangChain接入自定义爬虫-MCP工具
874°
- LangChain接入Filesystem-MCP工具
892°
- LangChain搭建MCP服务端和客户端流程
983°
- LangGraph与MCP技术概述
911°
- 姓名:Run
- 职业:谜
- 邮箱:383697894@qq.com
- 定位:上海 · 松江