用Python绘制正弦曲线
发布时间:2019-09-07 08:10:53编辑:auto阅读(4144)
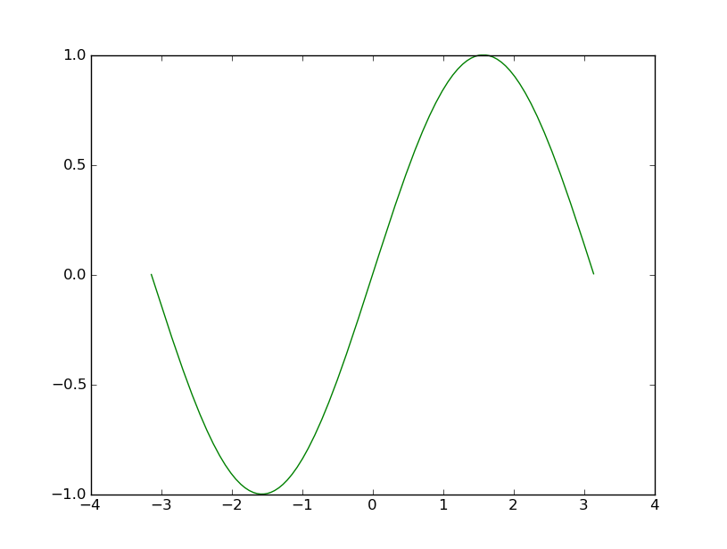
- >>>import numpy as np
- >>> import matplotlib.pyplot as plt
- >>> x=np.arange(-np.pi,np.pi,0.01)
- >>> y=np.sin(x)
- >>> plt.plot(x,y,'g')
- [<matplotlib.lines.Line2D object at 0x01AA20F0>]
- >>> plt.show()
今天学了Python 绘制了一幅正弦曲线 哈哈
需要numpy Python 库的支持
上一篇: python的logging模块详解
下一篇: Python 08 re 正则表达式
- H3C基本命令大全
53092
- H3C IRF原理及 配置
40017
- Python exit()函数
34398
- python全系列官方中文文档
30150
- python 获取网卡实时流量
25047
- 1.常用turtle功能函数
24846
- python 获取Linux和Windows硬件信息
23221
- 天天基金网数据接口
16700
- Selenium使用代理IP&无头模式访问网站
14854
- Selenium&Pytesseract模拟登录+验证码识别
14351
- LangGraph Studio可视化
689°
- LangSmith开发-应用入门
639°
- LangGraph开发-多轮对话问答机器人
705°
- LangGraph开发-条件分支/循环图实战
721°
- LangGraph开发-生态介绍,入门demo实战
765°
- LangChain-接入12306-HTTP MCP智能体
899°
- LangChain接入自定义爬虫-MCP工具
860°
- LangChain接入Filesystem-MCP工具
880°
- LangChain搭建MCP服务端和客户端流程
974°
- LangGraph与MCP技术概述
899°
- 姓名:Run
- 职业:谜
- 邮箱:383697894@qq.com
- 定位:上海 · 松江