原文链接:https://blog.csdn.net/Just_youHG/article/details/83904618
背景
《Python数据分析与挖掘实战》 案例2–航空公司客户价值分析
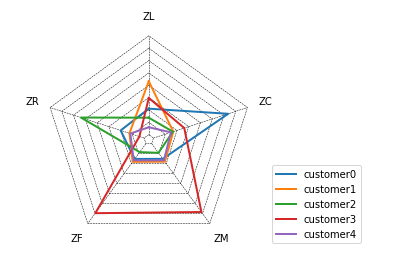
在该案例中的雷达图缺少相应的代码,查看相关文档之后,实现的代码如下。
数据
用于作图的数据对象名为data_cluster,数据展示如下:

注:其中(ZL,ZR,ZF,ZM,ZC)的值表示的是某个簇的聚类中心。
绘制 代码
import numpy as np
import matplotlib.pyplot as plt
def plot_radar(data):
    '''
    the first column of the data is the cluster name;
    the second column is the number of each cluster;
    the last are those to describe the center of each cluster.
    '''
    kinds = data.iloc[:, 0]
    labels = data.iloc[:, 2:].columns
    centers = pd.concat([data.iloc[:, 2:], data.iloc[:,2]], axis=1)
    centers = np.array(centers)
    n = len(labels)
    angles = np.linspace(0, 2*np.pi, n, endpoint=False)
    angles = np.concatenate((angles, [angles[0]]))

    fig = plt.figure()
    ax = fig.add_subplot(111, polar=True) # 设置坐标为极坐标

    # 画若干个五边形
    floor = np.floor(centers.min())     # 大于最小值的最大整数
    ceil = np.ceil(centers.max())       # 小于最大值的最小整数
    for i in np.arange(floor, ceil + 0.5, 0.5):
        ax.plot(angles, [i] * (n + 1), '--', lw=0.5 , color='black')

    # 画不同客户群的分割线
    for i in range(n):
        ax.plot([angles[i], angles[i]], [floor, ceil], '--', lw=0.5, color='black')

    # 画不同的客户群所占的大小
    for i in range(len(kinds)):
        ax.plot(angles, centers[i], lw=2, label=kinds[i])
        #ax.fill(angles, centers[i])

    ax.set_thetagrids(angles * 180 / np.pi, labels) # 设置显示的角度,将弧度转换为角度
    plt.legend(loc='lower right', bbox_to_anchor=(1.5, 0.0)) # 设置图例的位置,在画布外

    ax.set_theta_zero_location('N')        # 设置极坐标的起点(即0°)在正北方向,即相当于坐标轴逆时针旋转90°
    ax.spines['polar'].set_visible(False)  # 不显示极坐标最外圈的圆
    ax.grid(False)                         # 不显示默认的分割线
    ax.set_yticks([])                      # 不显示坐标间隔

    plt.show()
plot_radar(data_cluster)

