python3-PIL对比度拉伸
发布时间:2021-09-10 00:06:58编辑:run阅读(7717)
对比度拉伸操作是以低对比度图像作为输入,将强度值的较窄范围拉伸到所需的较宽范围,以输出高对比度的输出图像,从而增强图像的对比度。它只是一个应用于图像像素值的线性值的线性缩放函数,因此图像增强不会那么剧烈(相对于更复杂的直方图均衡化)。
在拉伸可以实施前,必须指定上下像素值的极限值(图像将在其上进行归一化),例如,对于灰度图像,为了使输出图像遍及整个可用像素值范围,通常将极限值设置为0和255。这一切的关键,只需要从原始图像的累计分布函数(CDF)中找到一个适合的m值。对比度拉伸变换通过将原始图像灰度级低于m值的像素变暗(向下限拉伸值)和灰度级高于m的像素变亮(向上限拉伸值),从而产生更高的对比度。
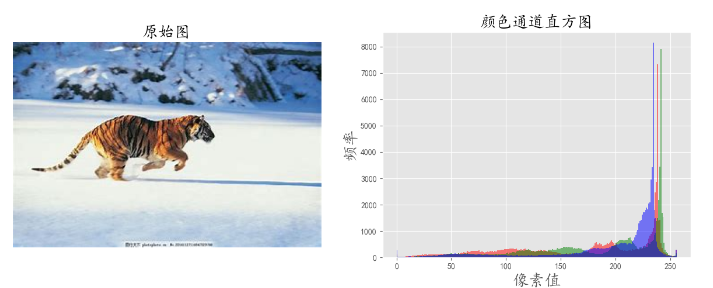
使用PIL操作,先加载一幅RGB图像,并将其划分成不同的颜色通道,以可视化不同颜色通道像素值的直方图。
from PIL import Image
from skimage import data, img_as_float,img_as_ubyte
import matplotlib.pylab as pylab
import numpy as np

pylab.rcParams['font.sans-serif'] = ['KaiTi']
pylab.rcParams['axes.unicode_minus'] = False
def plot_image(image, title=''):
    pylab.title(title, size=20)
    pylab.imshow(image)
    pylab.axis('off')
def plot_hist(r, g, b, title=''):
    r, g, b = img_as_ubyte(r), img_as_ubyte(g), img_as_ubyte(b)
    pylab.hist(np.array(r).ravel(), bins=256, range=(0, 256), color='r', alpha=0.5)
    pylab.hist(np.array(g).ravel(), bins=256, range=(0, 256), color='g', alpha=0.5)
    pylab.hist(np.array(b).ravel(), bins=256, range=(0, 256), color='b', alpha=0.5)
    pylab.xlabel('像素值', size=20)
    pylab.ylabel('频率', size=20)
    pylab.title(title, size=20)
im = Image.open(r'D:\image_processing\image4\c.jpg')
im_r,im_b,im_g = im.split()
pylab.style.use('ggplot')
pylab.figure(figsize=(15, 5))
pylab.subplot(121)
plot_image(im, '原始图')
pylab.subplot(122)
plot_hist(im_r, im_b, im_g, '颜色通道直方图')
pylab.show()
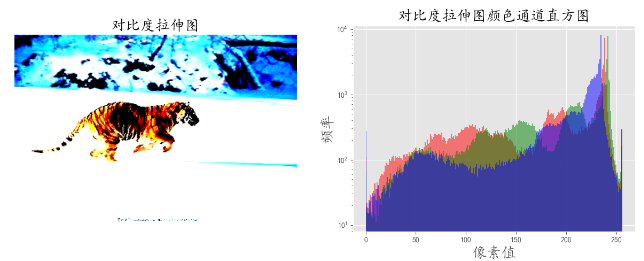
PIL的point()函数如何用于实现对比度拉伸。变换函数由contrast()函数定义为分段线性函数。
from PIL import Image
from skimage import data, img_as_float,img_as_ubyte
import matplotlib.pylab as pylab
import numpy as np

pylab.rcParams['font.sans-serif'] = ['KaiTi']
pylab.rcParams['axes.unicode_minus'] = False
def contrast(c):
    return 0 if c < 70 else (255 if c > 150 else (255 * c - 22950) / 48)
def plot_image(image, title=''):
    pylab.title(title, size=20)
    pylab.imshow(image)
    pylab.axis('off')
def plot_hist(r, g, b, title=''):
    r, g, b = img_as_ubyte(r), img_as_ubyte(g), img_as_ubyte(b)
    pylab.hist(np.array(r).ravel(), bins=256, range=(0, 256), color='r', alpha=0.5)
    pylab.hist(np.array(g).ravel(), bins=256, range=(0, 256), color='g', alpha=0.5)
    pylab.hist(np.array(b).ravel(), bins=256, range=(0, 256), color='b', alpha=0.5)
    pylab.xlabel('像素值', size=20)
    pylab.ylabel('频率', size=20)
    pylab.title(title, size=20)
im = Image.open(r'D:\image_processing\image4\c.jpg')
im1 = im.point(contrast)
im_r,im_b,im_g = im.split()
pylab.style.use('ggplot')
pylab.figure(figsize=(15, 5))
pylab.subplot(121)
plot_image(im1, '对比度拉伸图')
pylab.subplot(122)
plot_hist(im_r, im_b, im_g, '对比度拉伸图颜色通道直方图')
pylab.yscale('log', basey=10)
pylab.show()
可以看到,经过点操作后,每个通道的直方图已经被拉伸到像素值的端点.
使用PIL的ImageEnhance模块
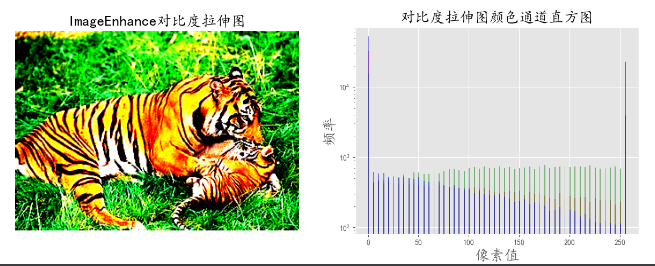
ImageEnhance模块也可以用于对比度拉伸。如何使用对比度对象的enhance()方法来增强相同输入图像的对比度。
from PIL import Image, ImageEnhance
from skimage import data, img_as_float,img_as_ubyte
import matplotlib.pylab as pylab
import numpy as np

pylab.rcParams['font.sans-serif'] = ['KaiTi']
pylab.rcParams['axes.unicode_minus'] = False
def plot_image(image, title=''):
    pylab.title(title, size=20)
    pylab.imshow(image)
    pylab.axis('off')
def plot_hist(r, g, b, title=''):
    r, g, b = img_as_ubyte(r), img_as_ubyte(g), img_as_ubyte(b)
    pylab.hist(np.array(r).ravel(), bins=256, range=(0, 256), color='r', alpha=0.5)
    pylab.hist(np.array(g).ravel(), bins=256, range=(0, 256), color='g', alpha=0.5)
    pylab.hist(np.array(b).ravel(), bins=256, range=(0, 256), color='b', alpha=0.5)
    pylab.xlabel('像素值', size=20)
    pylab.ylabel('频率', size=20)
    pylab.title(title, size=20)
im = Image.open(r'D:\image_processing\image4\d.jpg')
contrast = ImageEnhance.Contrast(im)
im1 = contrast.enhance(5)
im2 = np.array(contrast.enhance(5).getdata()).astype(np.uint8)
pylab.style.use('ggplot')
pylab.figure(figsize=(15, 5))
pylab.subplot(121)
plot_image(im1, 'ImageEnhance对比度拉伸图')
pylab.subplot(122)
plot_hist(im2[...,0], im2[...,1],im2[...,2], '对比度拉伸图颜色通道直方图')
pylab.yscale('log', basey=10)
pylab.show()
原始图:

对比度拉伸图

可以看到输入图像的对比度增强,色彩通道直方图向端点拉伸。
上一篇: python3-scikit幂等变换
下一篇: python3-PIL二值化
- openvpn linux客户端使用
51904
- H3C基本命令大全
51663
- openvpn windows客户端使用
41994
- H3C IRF原理及 配置
38830
- Python exit()函数
33317
- openvpn mac客户端使用
30296
- python全系列官方中文文档
28937
- python 获取网卡实时流量
23946
- 1.常用turtle功能函数
23865
- python 获取Linux和Windows硬件信息
22236
- Ubuntu本地部署dots.ocr
331°
- Python搭建一个RAG系统(分片/检索/召回/重排序/生成)
2550°
- Browser-use:智能浏览器自动化(Web-Agent)
3226°
- 使用 LangChain 实现本地 Agent
2681°
- 使用 LangChain 构建本地 RAG 应用
2667°
- 使用LLaMA-Factory微调大模型的function calling能力
3387°
- 复现一个简单Agent系统
2631°
- LLaMA Factory-Lora微调实现声控语音多轮问答对话-1
3465°
- LLaMA Factory微调后的模型合并导出和部署-4
5690°
- LLaMA Factory微调模型的各种参数怎么设置-3
5491°
- 姓名:Run
- 职业:谜
- 邮箱:383697894@qq.com
- 定位:上海 · 松江
